info@meradia.com


PREFACE
Jose Michaelraj CIPM, CAIA, a Senior Manager at Meradia, specializes in optimizing performance operations and technology for asset managers, asset owners, and custodians. With deep expertise in modern data management techniques, Jose has reorganized performance processes, assessed attribution platforms, and developed a pattern recognizing validation tool. Jose frequently writes about bridging business needs with innovative techniques and has published in the Journal of Performance Measurement and CAIA blogs. His book, “Investment Performance Systems – Aligning Data, Math & Workflows”, was published on February 18th, 2025.
Kayalvizhi T, is an aspiring Machine Learning Architect and a Goldman Sachs IWE League Scholar. She is the technical brain behind DQ4.6 and designed and developed the entire code. She has written about optimization techniques, such as Gradient Descent, and ML algorithms, such as decision trees. Leveraging data science techniques and mining algorithms, she developed an application to increase matching rates and reveal exception patterns. A full-stack developer who is well-versed in Python, she likes to blend machine learning techniques with user-centric solutions.
SUMMARY
Quality data checks are vital to investment performance operations. It validates return accuracy and ensures completeness. Performance operations personnel frequently decide to either confirm or reject the validity of calculated returns. Expertise and spontaneous discovery of data patterns underlie decision making.
Can we unearth the heuristics that users employ to check performance data quality?
Should we solely rely on canned algorithms to unearth patterns?
How can business function drive machine learning instead of the other way around?
Is there a win-win model where users and algorithms come together to enhance productivity?
This exploratory paper utilizes machine learning techniques to provide insights on these questions.
By extending available algorithms and incorporating specific themes for investment data, we develop a novel model to uncover the heuristics behind performance quality checks.
Data Quality Rules
Maintaining Real-Time Performance Monitoring Rules Is Difficult.
Precise data inputs are required to calculate accurate performance returns. Incorrect, delayed, and incomplete data could result in incorrect returns. Sans quality checks, these could fall into the hands of investment teams, clients, and other stakeholders, raising concerns. Quality checks are of two types:
- Performance ready checks: These determine the quality of the input data prior to the return calculation process. They ensure systemic resources are utilized effectively without unnecessary reruns.
- Performance monitoring checks: These are the last line of defense before returns and analytics are disseminated for reporting. They provide greater confidence to disseminate returns to performance consumers.
This paper is focused on uncovering the heuristics behind monitoring checks done by the performance operations team. Some monitoring checks are sacrosanct. For example, checking if security or portfolio returns are zero. Once defined and set in systems, they can be left unchanged; however, others could vary. For example, a daily security return greater than a threshold say 5% could change over time. Under more volatile periods, the threshold is relaxed and under tight market conditions, the threshold is decreased. Furthermore, each asset class could have a different threshold¹.
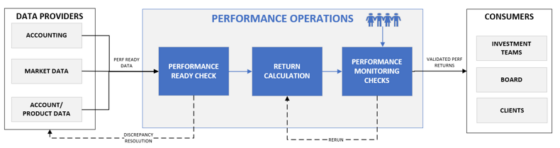
FIGURE 1: Simplified Performance Operations Process
Performance personnel mosaic a wide variety of publicly available knowledge, such as news announcements, alternative pricing information, corporate actions, etc. to ascertain if some of the systemic breaks are invalid or if any of the systemic confirms should be rejected, i.e. returns considered valid by the system be deemed as breaks. In other words, they override systemic output based on expertise and recently acquired information to validate returns.
Rarely is the intuition behind passing or failing a quality check based on random thoughts or extrapolated assumptions. Mostly, it is a framework happening in the user’s mind, with data as the primary anchor.
Can we uncover such heuristics through machine learning techniques?
Machine Learning Models & Decision Rules Framework
Predictive Modeling Using Decision Rules Framework Provides Explanatory Power.
Modern data analysis offers a wider variety of capabilities to solve problems. Whilst there is a lot of talk about Generative AI, we believe traditional machine learning techniques offer immense potential to derive benefits for Investment Operations. Finding the right set of techniques to solve the problem at hand is key.
Data Quality use case falls under supervised learning, where computers learn to model relationships based on labeled training data.
During the performance quality check process, operations personnel view a set of records – often a combination of account, security and accounting data in conjunction with generated returns – to determine if the performance return is valid or not. It is denoted as either “Pass” or “Fail”.
- Pass: Observed return is not an exception. It is deemed valid and ready for official reporting and stakeholder consumption.
- Fail: Observed return is an exception. It has potential issues and requires further investigation.
The key lies in deciphering rules from these patterns. Once the rules are uncovered, they can be used to predict and classify future exceptions. Predictive classification² algorithms discover rules.
While there are a variety of techniques used in predictive classification, we use a Decision Rules-based Framework as it is easy to interpret.
TRAINING DATA
Create An Unbalanced Dataset. Fails Are More Important Than Passes.
Our dataset contains 811 records with 5 main properties. A record represents a portfolio on a particular date.
a. Time-series: Daily data was simulated for 3 months for nine portfolios. All data pertained to the portfolio or total level.
b. Feature Definition: Accounting data such as market values, performance-ready data such as flows, and performance data including Gross & Net Returns are created for portfolios and benchmarks. Certain derived inputs or features are also created, such as Flows/Market Value and Portfolio Return – Benchmark Return. Collectively, these features set the boundaries under which the algorithm operates and prevent spurious generation of rules. They have been selected based on our experience to represent a variety of important conditions under which exceptions are encountered.
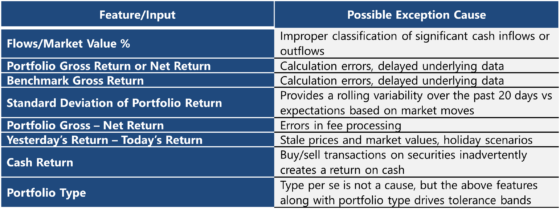
TABLE 1: Feature Definition
c. Classes: There are two classes “Pass” and “Fail”, and each record is assigned one of these values.
d. Skewness: Data distribution should reflect real time scenarios. Typical operating conditions in most firms entail a substantial proportion of the data to not have errors. Number of passes is greater than the number of fails. Hence in our dataset of 811 records, 771 (>90%) were denoted as Passes and 40 denoted as Fails. It is important to identify the rules that drive the identification of Fails rather than the identification of Passes.
Model DQ4.6
Employ Specific Themes To Account for Quality Checks Using Investment Data.
Many applications of artificial intelligence related to tasks of practical importance are based on constructing a model of the knowledge used by a human expert. Specifically, our model called DQ4.6 extends Quinlan’s C4.5 algorithm in the following ways³.
- Feature Conversion: We convert continuous-valued data into nominal categories using threshold-regulated features before feeding into our model. Threshold-regulated features are defined in intervals of 1% (100 basis points, configurable in our model). For example, Portfolio Return >1, Portfolio Return >2, Portfolio Return >3, etc. We believe most performance users typically think in unit intervals while validating returns. This step reduces computational cost and prevents the model from being overly sensitive to outliers.
- Feature Selection: We create all possible rules in the hypothesis space and employ Gain Ratio⁴ to effectively handle unbalanced datasets as well as a threshold.
Model VALIDATION
Our rules follow a specific structure, often involving comparisons against fixed values. They take the following forms:
- |Feature| > Fixed Value
- |Feature 1 – Feature 2| > Fixed Value
- |Feature 1/Feature 2| > Fixed Value
- Feature = NULL
- Feature = A fixed character string, such as EQ/FI, etc.
We now proceed to compare the rules identified by our model with the actual rules used for mocking up data. We display here only the results for ‘Fail’ class i.e. exceptions, which is our principal objective. The model also can provide a bouquet of rules with strong explanatory power to identify failures. This offers the users the option of picking new data quality rules over ones that were used to identify exceptions.
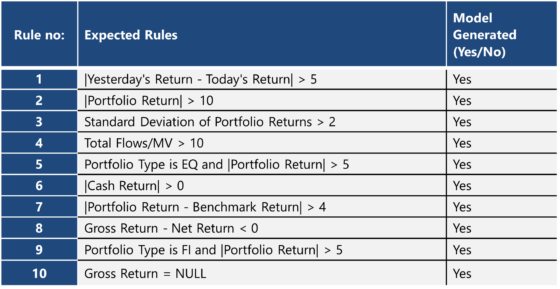
TABLE 2: Expected Rules vs. Model Output
CONCLUSION
By simulating data, applying quality checks and adapting available algorithms, we have codified the heuristics employed during quality check process. Performance is one example to illustrate that the model works. We believe that DQ4.6⁵ can be leveraged for quality check processes within most departments in investment management firms.
The true potential of machine learning models has a transformational impact on Investment Operations. Humans in conjunction with machine learning models are armed to scale Operations better. Augmentative intelligence moves Operations from an ‘Investigation-Fix’ mindset to ‘Review-Affirm’ paradigm. It helps to significantly reduce investigation effort, uncover remedial tolerance bands and lower analysis effort during regime changes.
Self-correcting, auto-learning operational models start to emerge. The advance of technology is based on making it fit in so that you don’t even notice it, so it’s part of everyday life⁶. We hope that this paper stimulates discussion and debate on that front.
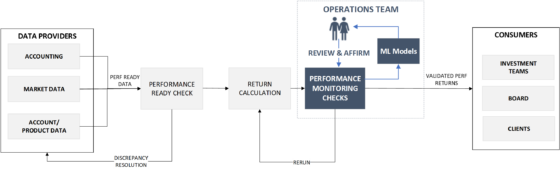
FIGURE 2: Self-correcting, auto-learning Operational Models
The authors would like to thank their mentor Vijay Chandrasekhar, an Investment Performance data expert with machine learning interests who explored this idea with us, perhaps more deeply at times.
REFERENCES:
¹For a list of quality rules and best practices, refer to Data Quality Working Group – Report of Findings published in the Journal of Performance Measurement, Fall 2023.
²Other forms of machine learning methods include Anomaly detection, Cluster analysis and association analysis. Each have their unique applications.
³C4.5 Programs for machine learning – J. Ross Quinlan
⁴Many forms of criterion can be used to measure the quality of branches split in a decision tree. Some examples are Gain Ratio, Information Gain and Gini index.
⁵The code for DQ4.6 is written in Python.
⁶Quote attributed to Bill Gates.
Download Thought Leadership Article Process Design and Change, Solution Design, Strategy and Roadmap Data and Technology, Performance, Risk & Analytics Asset Managers, Wealth Managers Jose Michaelraj