info@meradia.com


Laurie Hesketh, CIPM began the ‘Performance is Data Series’ proclaiming that Investment Performance is “an enterprise data function in disguise.” Between dozens of downstream consumer perspectives, exorbitant volumes of generated data, and an assortment of inherited upstream data, Performance resides at the nucleus of a firm’s data function. Jose Michaelraj, CIPM, CAIA, and Andrew Jacob, CFA joined the Performance is Data conversation, further exploring the efficiencies gained and lessons learned from Performance’s unique alliance with data to drive Operational Transformation and Data Governance Programs, respectively. Their mutual conclusions delve into the benefits Performance provides to promote positive outcomes outside of merely calculating analytics and investment performance results.
Consider the irony… Performance departments exert their time and energy to calculate performance results that inform consumers of the impacts of their decisions on investments. Though Performance executes complex calculations and solves firm-wide data challenges for consumers’ benefit, oftentimes they forget to measure the most important performance of all… their own. This fourth installment of the Performance is Data Series explores exactly how Investment Performance teams can embark on a key performance indicator (KPI) centered approach to measure more than just the performance of others and introspectively assess operations.
“IF YOU CAN’T MEASURE IT, YOU CAN’T MANAGE IT.” – PETER DRUCKER
Management guru Peter Drucker said, “If you can’t measure it, you can’t manage it.” KPIs serve as the tape measure for performance managers and other key stakeholders to define and quantify the performance of Performance. The breadth of consumers which Investment Performance serves creates competing stakeholder interests towards what defines a successful operation. Decomposing consumers’ priorities into achievable KPIs allows Investment Performance functions to foster continuous improvement. Firms that take the time to set difficult and specific measurement goals at the outset find that they do a better job choosing tools and defining the ownership necessary to achieve them. Prioritizing the data required to support KPIs aligning with organizational objectives enables ongoing success for Investment Performance Operations. Exposing KPIs through a dashboarding framework is the final step in the gauntlet of enabling a manageable Performance Operation.
TOP-DOWN APPROACH DEFINES KPIs AND FORECASTS VISION
Effective KPIs are rooted in activities and responsibilities owned by the function for whom they benefit, with defined processes for said responsibilities. Activities then align with organizational goals, critical success factors, and priorities specific to the type of firm. Wealth managers, for example, may prioritize volume and scalability, while asset managers prioritize quality and efficiency. Asset owners may view multi-asset capability and quality as important, and APAC consumers value client expectations and quality. KPIs can only serve stakeholders with stakeholder input. Confirming organizational goals align with stakeholder expectations and nuanced preferences allows for improved organizational alignment. These preferences could include different weighting, inclusions, or exclusions in calculating a KPI.
For example, a firm values data quality and accuracy and decides to begin calculating the number of quality breaks across all performance results. Should return outliers in GIPS composites qualify as a break in quality? The answer lies in the goal of collecting the metric. Is accuracy prioritized to avoid reporting faulty returns to clients or because quality breaks trigger additional workflows, reducing efficiency in the performance team? Reinforcing the organization’s goals through KPIs allows Performance to support firm success. This top-down approach to a KPI program aligns with the organization’s vision and represents stakeholders’ interests.
THE JUMP FROM CONCEPT TO CREATION IS A REALITY CHECK
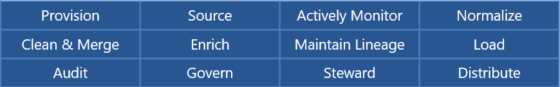
Building KPIs around goals and activities reveals not all KPIs are created equally. Some tackle multiple stakeholders’ expectations while others are simply available in the current data architecture with a weak business case. The complexity of deriving KPIs coupled with the overlap and availability of underlying data required impacts the organization’s delivery against the overall vision. Performance teams self-constrict by neglecting readily available, on-hand data that drives systems but is not yet packaged in a KPI-friendly manner (e.g., audit or system logs, timestamps, entity/relationship mapping).
Performance leaders who effectively manage their organization prioritize data required to measure underlying activities. Making the jump from conceptual to actionable requires teams to analyze available data assets and determine what to adapt to deliver early benefits and take advantage of low-hanging fruit. A data-mindful Performance team that recognizes the below data management activities can unlock the keys to measure said activities, while a data-naïve Performance team may not recognize the opportunity.
EXECUTION REQUIRES REAL DATA SCENARIOS. HENCE, A BOTTOM-UP ANALYSIS
Despite the past decade of the industry loudly proclaiming the importance of data, few financial ecosystems are plumbed to facilitate effective monitoring of data activities. Without leading with KPIs in mind, systems have not been designed to facilitate easy interrogation of underlying data activities. Performance systems effectively calculate results but lack sophisticated tools to expose data-oriented metrics.
The analysis required to facilitate the explicit definitions of KPIs, and their associated dimensionality is tedious. There are two sides to this analysis, the mathematical formula, and the data challenge to facilitate the mathematical formula. This concept is not foreign to Performance, as previously outlined in the first paper of the Performance is Data Series, but a system capable of calculating more than Investment Performance results is new to many. Previous system documentation accelerates the analysis, but Performance teams with data architectures containing siloes (whether team or system siloes) feel the disjointedness through the analysis. Simply, more challenges require more solutions, and more challenges arise from older data architectures. Dashboards are cross-functional by nature hence organizations with cross-functionality at the forefront of their data strategy find success more frequently. Alternatively, dated architecture will create barriers to scale the KPI initiative. Uncovering the aforementioned gaps requires a bottom-up analysis of the data.
Both a top-down and bottom-up approach are important to maturing a KPI program. The approach is a hybrid where metrics and KPIs are conceptually defined and aligned in a top-down manner while the requisite analysis, data capture, storage, transformation, and calculation that feed the KPIs are tackled from the bottom up. Converging on the common denominator of both approaches, KPIs, illuminate the maturity of the firm’s enterprise data management while delivering a stakeholder-focused tool to quantify the activities supporting Investment Performance Operations.
VISUALIZATION OF KPIs ENABLES MEANINGFUL INTERPRETATION AND ACTION
While both the metric and meaning hold importance, the true power of KPIs surfaces through visualization. The feedback loop created through visualizing relevant KPIs on pertinent dimensions provides a meaningful quantification to previously immeasurable aspects of the business. For example, the number of data breaks spanning a period is less impactful than the same measure displayed as a trending time series.
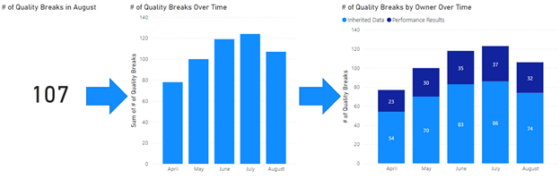
Source: Meradia
Visualization tangibly improves and uncovers previously shrouded or misunderstood business challenges as it enables users to quickly grasp information immediately leading to more powerful interpretation and action. The first step in addressing a challenge is knowing it exists. Pictures tell a story; our brains respond differently to them. They inspire change and meaningful change at that.
DON’T GET LEFT IN THE DUST… HOP ON THE KPI BANDWAGON
Work done to establish the right KPIs and focus teams on the levers needed to achieve them demands improved focus on data, ownership, and tools. A focus on establishing the right KPIs that align with organizational objectives enables transformation efforts to achieve real value. A strategic approach to data quality for Investment Performance starts with a goal to measure the ingredients necessary to achieve it and a willingness to embrace that effective data management IS the job.
If operational efficiency directly correlates to profitability, it is worth both investment and focus to get it right in this critical area. The best outcomes start with having the right tools, clear ownership, and measurable KPIs.
Data remains a hot topic across the industry and will not go away any time soon. As more organizations begin using their existing data, capturing more, and enhancing usage, companies standing by old practices will evidently lag the competition.
Download Thought Leadership Article Conversion and Implementation, System Rationalization Data and Technology Asset Managers Clay Corcimiglia