info@meradia.com


RISK STATISTICS – WHICH ONES?
An expansive list of ex-post risk statistics is used in performance analysis to provide insights into portfolio management decisions. Broadly, these can be classified into two types.[1]
- Absolute risk adjusted performance measures – these utilize a reference rate other than a benchmark
- Relative risk adjusted performance measures – these evaluate a portfolio’s returns with reference to a benchmark
This paper covers both types of risk measures. The concepts and data management considerations referenced herein apply to the wide gamut of risk statistics calculated with more than one return series. Most ratios (Sharpe, Information, Sortino, etc.) fall within this category. A small subset of statistics (Drawdown, Up capture, Best & worst periods, etc.) that are evaluated by considering only the portfolio return series are not within the scope of this paper.
PERFORMANCE OPERATIONS: EMERGENCE & PREVALENCE
‘Performance’ and ‘risk analytics’ used to be distinct departments operating in their own silos with return calculations handled by front office personnel. Standards in calculating returns coupled with increased computational power gave rise to a new function called performance operations. The first benefit of performance becoming operational is that it moved the do-it-yourself front office methods to streamlined back office . The continued expansion of operations saw risk folded under its umbrella and ‘Performance & Risk Analytics’ departments becoming common in large asset management firms.
‘SIMPLIFIED’ PERFORMANCE WORKFLOW[2]
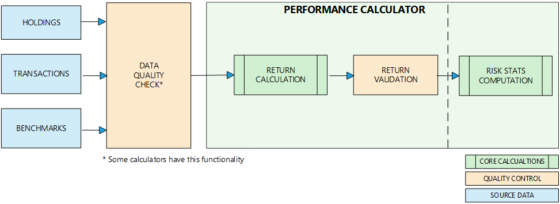
Performance calculations and risk statistics are closely related. A typical performance workflow starts with the acquisition of holdings and transaction information followed by a data quality check process to ensure there are no significant gaps. The performance calculation process then kicks in, generating various single period returns (Modified Dietz, IRR, etc.); for example, returns at the highest denominated frequency defined for a portfolio. Depending on the nature of the portfolio, this could be daily, monthly or quarterly.
Benchmark returns could either be sourced directly from market vendors or undergo a similar path (custom benchmarks) as mentioned for portfolios. A second type of validation process is done to clean abnormal returns and check the reasonability of portfolio returns vis-à-vis the benchmark. Abnormal returns are defined as those which misrepresent the true economic performance[3]. A logical next step is the calculation of multi-period returns. Once returns are available for a large set of dates for both the portfolio and benchmark, risk statistics are computed.
CALCULATOR IN A SIMPLE WORKFLOW
THE ‘DATA MANAGEMENT’ LENS
The previous two sections describe how cohesively performance and risk fit together from an evolutionary and operational workflow perspective. To determine the fit from a data management standpoint, we pose three questions:
- What data is required? To compute most of the relative risk statistics, a minimum of two return streams are required: portfolio return stream and reference return stream. The reference stream could either refer to a market index or a peer group.
- Where is the data located? Performance operations personnel compare the return of a portfolio to its benchmark at several levels before publishing the final numbers. The nature of the performance workflow necessitates portfolio and benchmark returns to reside in a performance calculator.
- What is being calculated? Risk statistics calculated involves a mathematical formula that generally takes the form (A-)/C. A and B refer to two return streams for which the data is within a calculator. Additionally, A and B could represent average or annualized returns. C refers to a risk measure. Standard deviation is a popular risk measure used in many calculations and can take several forms. Some common scenarios for calculating standard deviation utilize portfolio returns, benchmark returns, difference of portfolio and benchmark returns or including returns only below the mean (e.g. semi deviation). Taking Sharpe ratio as an example to apply the above generic construct, it is calculated as (Rp – Rf)/p. Rp is the portfolio excess return, Rf is the risk-free return and p is the standard deviation of the excess return.
A ‘NATURAL’ FIT?
The main job of performance calculators is to derive returns utilizing holdings and transaction data. Computing security level returns and aggregating across different sectors and/or groups for a portfolio is at the core of the calculator. This kernel performs mathematical functions that take the form (X-Y)/Z where X=the ending market values, Y=beginning market values and possibly weighted transaction flows, and Z=beginning market values and could include transaction amounts depending on the weighting methodology used.
Availability of required data inputs and the potential to perform similar mathematical functions makes performance calculators the intuitive choice for calculating risk statistics. Statistics calculation being the subsequent process in the operational workflow after returns, they also provide synergies from a process automation perspective.
CONCLUSION
In this Part 1 of a two-part series we have demonstrated the potential benefits of performing risk computations in a performance calculator. Organizational structure within asset management firms, co-located data and related mathematical constructs present a strong business case advocating the cause.
Is it an open and shut case? Look for insights in Part 2.
HOW MERADIA CAN HELP
Meradia, with its combination of domain experts and technology experience, is uniquely positioned to address challenges in the performance systems arena. Whether it’s performance systems re-engineering, integration or new product development, our collective expertise with several platforms will provide your organization with valuable perspectives.
[1] Performance Measurement for Traditional Investment Literature Survey January 2007, Le Sourd, Valerie.
[2] Although returns aggregation/classification, attribution processes and composite calculations are critical to a performance workflow, these have not been addressed to avoid complexity. The intent is to highlight interaction between returns and risk and this simplification aids clarity. Simplification does not necessarily mean simplistic.
[3] For a coverage of common scenarios that generate ‘odd’ results, refer to Abnormal returns, Journal of Performance Measurement – Spring 2016.
Download Thought Leadership Article Solution Design Performance, Risk & Analytics Asset Managers Jose Michaelraj