info@meradia.com


INTRODUCTION
Most firms know their data is valuable but capturing that business value can be challenging. Studies show that poor data quality costs organizations an average of $15 million per year (Gartner, Actian). Data governance tools enable employees to independently validate how to use a given field or search for potential matches for a business purpose, helping organizations save time. While this provides business value, it’s only a starting point for what’s possible in a fully developed data model. More basic features help users locate answers to known questions, but a fully developed model can help bridge the gap between providing what users think they need vs what they may need.
Data teams currently spend approximately 30–40% of their time managing data quality issues instead of focusing on revenue-generating activities (Monte Carlo Data).Several text analysis techniques to help accelerate the process of transforming a business glossary from a basic dictionary-based tool to a complete model that encompasses coupling terms with similar terms and their use cases. These features turn your data into a product individuals can leverage to create more value for your firm.
WHAT IS A BUSINESS GLOSSARY, AND HOW IS IT SET UP?
To enable the design of a product (or investment data management tool), you first need to create and maintain a business glossary. This business glossary forms a definitional basis for business terms, pairing plain spoken terminology with the location of the data within your architecture. Some introductory text analysis techniques can enhance even this most basic portion of the data model. For example, while de-duplicating exact matches of terms or definitions is simple, identifying near matches can be a tedious and manual process. By utilizing similarity metrics, we can reduce the manual effort by automating the comparison of terms and filtering for similarities above a certain threshold. This increases the quality of the business glossary by helping to establish synonyms and guiding users to similar terms they may intend to use.
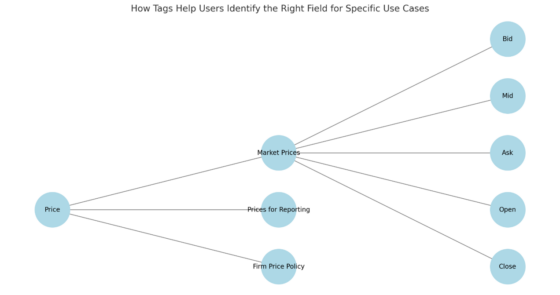
FIGURE 1
LOGICAL GROUPINGS
Once you fully establish this definitional basis, use it to design the logical grouping of the data model. The logical grouping pairs the definition and physical location of the data, compiling it into similar groups to allow you to control your data. For example, all bid, mid, and ask fields in each cloud-based platform may be grouped into an overarching pricing group. These groupings help users identify what options are available when constructing a report or risk model. Since the logical grouping includes data location combinations, you can leverage this to create data sets of the corresponding defined terms, providing context for the fields in the form of definitions, synonyms, and tags. By leveraging similarity metrics and determining relevant clusters through k-means analysis, you can greatly accelerate this process. K-means analysis groups similar words and phrases using relevant text metrics, helping provide a base level for further enhancement.
CONCEPTUAL GROUPINGS
While the logical grouping described is a significant step forward in the data model, its silos result by the system and lacks the overarching context necessary to provide the best insight to users. Outside of this conceptual grouping, users commonly need to know what specific terms or fields they’re looking for as part of their question. Within this conceptual grouping, users only need to know the business problem they’re trying to solve. The conceptual grouping of the data model sets up the most relevant fields for a given business purpose, adding context to explain how and why the fields are used.
For example, a grouping titled “how to value swaps” would include the right “clean price” field from the right vendor and explain why the user should use the price that excludes accrued interest. It would also contain the field that reflects the end-of-day notional value net of new trades, any fields reflecting life cycle events, and any local currency considerations. Arranging all these fields into the calculation can produce a position-level valuation. These additional features offer context that users may not have been aware of in their initial search, providing the best fields for the full formula along with expert context to explain the reasoning. This saves considerable time across the organization by eliminating the need to inquire about appropriate fields, their usage, and where to obtain the underlying data. This level of understanding empowers users to develop their own models for new purposes and fully leverage data as a product.
HOW MERADIA CAN HELP
At Meradia, we have the tools and the strategy to help your firm get the most out of its data model and governance platform. With over twenty-five years of industry experience and deep expertise in products, systems, and industry best practices, we can accelerate the development of your data model and help your firm unlock its value. Whether you’re just getting started or are looking to advance your model to the next level, Meradia’s insights can help your firm achieve its goals.
Download Thought Leadership Article Process Design and Change Data and Technology Asset Managers, Industry Vendors Jake Daly-Leonard